Showing posts with label demographics. Show all posts

Thursday, October 23, 2008

Study Released About New Demographic Powerhouse.


Much has been made of Barack Obama's mixed-race heritage. For better or worse, more ink and pixels have been expended during this campaign discussing race than perhaps any other topic. We've seen both overt and covert attempts to appeal to voter's baser instincts by some, and insightful and thought provoking analysis of our emerging multi-racial and multi-cultural nation by others.

Only those living under rock for the past year would not be familiar with Obama's family history. The son of a black father and white mother who married young then divorced, he lived in Indonesia as a child with his stepfather, then returned to Hawaii to be raised by his maternal grandparents.

While it's well know that Obama's father was Kenyan, little is made of the fact that he is the child of an immigrant …. Yet, this makes him part of one of the fastest growing, and politically important demographics in the nation.

Today in California, half of all teens have at least one immigrant parent, and throughout the nation the number of 18-25 year olds who can trace their ancestry in this country back no further than their parents grows daily. Among all Latinos, 40% have immigrant parents, and Asians, 90%.

Obama, in a way, represents the leading edge of a demographic boom of children born of immigrant parents who will continue to come of age far into the future with ramifications politically, socially, and culturally, that could be monumental.

A new study, released today by the Immigration Policy Center, entitled, "The New American Electorate: The Growing Political Power of Immigrants and Their Children", looks not only at the growing power of this demographic, but the vast numbers of newly naturalized citizens, and the Latino and Asian communities from which they come.

At a time when federal, state, and local elections are often decided by small voting margins—with candidates frequently locked in ferocious competition for the ballots of those “voting blocs” that might turn the electoral tide in their favor—one large and growing bloc of voters has been consistently overlooked and politically underestimated: New Americans. This group of voters and potential voters includes not only immigrants who have become U.S. citizens (Naturalized Americans), but also the U.S.-born children of immigrants who were raised during the current era of large-scale immigration from Latin America and Asia which began in 1965 (the Post-1965 Children of Immigrants).

These immigrants and their children have a powerful and highly personal connection to the modern immigrant experience that most other Americans do not. It’s one thing to hear family stories about a grandfather or great-grandfather coming to the United States during the much-romanticized “Ellis Island” era of immigration from Europe that ended decades ago. It’s quite another to belong to a family that is experiencing first-hand the political and economic realities of immigration today. The ranks of registered voters who are New Americans, or Latino or Asian, have been growing rapidly this decade and are likely to play an increasingly pivotal role in elections at all levels in the years to come, particularly in battleground states like Florida, Colorado, Nevada, and New Mexico. As recent public opinion polls reveal, anti-immigrant political rhetoric is likely to motivate many New Americans to cast ballots in November, but is unlikely to win many votes for candidates perceived as anti-immigrant.

Link(pdf)


To get some idea of the current size of this population and the growing political potential in holds, one need only look at a few key statistics.

  • New Americans were 8.6 Percent of All Registered Voters in 2006
    - 7.6 million were Naturalized Americans, accounting for 5.6 percent of registered voters.
    - 4.1 million were Post-1965 Children of Immigrants, accounting for 3.0 percent of registered voters.

  • Latinos and Asians Accounted for 9.3 Percent of All Registered Voters in 2006
    - 9.3 million Latinos comprised 6.8 percent of registered voters.
    - 3.3 million Asians accounted for 2.5 percent of registered voters.


In the past two years, an additional 3 mil new naturalized citizens have become eligible to vote, and conservative estimates put the number of currently registered Latino voters at 11.7 million. Each month, nationally, 40,000 Latino teens turn 18 and become eligible to vote. Obviously, when all these groups with immigrant family ties; New immigrants, their children, Latinos and Asians are looked at on whole, their growing numbers and growing political power makes them a key demographic not only in 2008, but for the future.

New Americans (including both naturalized citizens and the children born to immigrants in the United States since 1965), Latinos, and Asians are increasingly important to the outcome of elections at the federal, state, and local level in the United States. Yet immigration and the ongoing racial and ethnic diversification of the American electorate have received relatively little attention from pundits and analysts discussing the 2008 vote and the electoral outlook for future elections. However, as naturalized citizens and their families grow into sizable portions of the electorate, political candidates who fail to recognize the growing importance of New American, Latino, and Asian voters increasingly undermine their own campaigns.

The U.S.-born children of immigrants in particular are increasingly important in the voting booth. These children occupy a unique position in U.S. society in that they have watched one or both of their parents navigate a new society and culture. As a result, they are personally connected to the struggles of immigrants and to the ways in which U.S. society reacts to and treats immigrants. There were nearly four million of these Post-1965 Children of Immigrants registered to vote in 2006.

Immigrants who have become U.S. citizens (Naturalized Americans) and the U.S.-born children of immigrants are closely connected to, and many are a part of, the Latino and Asian communities in the United States. Latinos and Asians include not only immigrants and their children, but also families that have lived here for many generations. In general, Latinos and Asians have a close connection to the immigrant experience because they are immigrants themselves, or their parents were immigrants, or they live in neighborhoods where friends and extended-family members are immigrants.

Apart from sheer growth in their numbers, two key factors are transforming New American, Asian, and Latino voters into a potent electoral force which is changing the nature of elections and political campaigns nationwide.

First, immigrant communities can now be found throughout the United States. No longer concentrated in just a few states like California, Florida, New York, and Texas, immigrants are becoming a sizable portion of the population in states like Nevada, Washington, and North Carolina. Second, contemporary elections are often won by very thin voting margins. In 2004, for example, President Bush carried Ohio by just 119,000 votes, or 2 percent of all registered voters, while Senator John Kerry won Michigan by a margin equaling 3 percent of registered voters.

The combination of wide geographic dispersion and increasingly close elections means that New American, Latino, and Asian voters can play a crucial role in elections taking place in “battleground” states where neither the Democratic Party nor the Republican Party has a decisive edge.

Link(pdf)


“The campaigns, pundits and press have spent this entire election cycle searching for a new and weighty voting bloc." said Angela Kelley, Director of the Immigration Policy Center, speaking on the release of the report. "Their search is over. Step aside Soccer Moms and NASCAR Dads. New Americans are ready to vote. This group has been decades in the making and they are certain to flex their voting muscles this year”

And for any of those with doubts about the pivotal role immigration reform, and how politicians deal with it, plays in motivating this growing and politically active demographic, one simple statistic should end them: In 2006, 45% of all Latino voters between the ages of 18 and 24 either took part in, or had close family members take part in, the large-scale immigration marches that took place throughout the nation. ….Giving new meaning to the slogan, "Today We March – Tomorrow We Vote".


READ COMPLETE STUDY HERE(pdf)

READ MORE about "The New American Electorate: The Growing Political Power of Immigrants and Their Children" from Henry Fernandez at Think Progress

WATCH VIDEO of IPC panel discussion of report on C-Span HERE


Read More...

Tuesday, October 30, 2007

Losing the war of words

Last week when speaking on the immigration, Rep. Rahm Emanuel (Ill.), chairman of the House Democratic Caucus, said that "For the American people, and therefore all of us, it's emerged as the third rail of American politics, and anyone who doesn't realize that isn't with the American people."

For many in the migrant-rights movement these words mark a crucial turning point. As a leading voice in the DLC/centrist wing of the Democratic Party, Emanuel's comments telegraph a message that in order to further cement an almost guaranteed Democratic victory next November, the Democratic establishment is more than willing to pander to the right and throw immigrants under the bus.

Today, Democracy Corps, the Democratic centrist think tank published a full statement on their recommendations for handling the immigration issue going forward. Needless to say the group founded by James Carville, Robert Shrum and Stanley Greenberg, not only echoes Emanuel's sentiments, but expands upon them.

Having completed their polling and focus groups, they found that much of the misinformation and propaganda propagated by the Right over the last two years has found its place in popular opinion, particularly with those who identify as the all important independent swing-voters.

Although admitting that many of these opinions are "improbable" beliefs, and "impressions (that) conflict with the facts", these Democratic strategists advise that candidates take positions that pander to them.

As much as this says about the cynical and self-serving nature of the Democratic centrists, it also speaks volumes to our own inability to control this debate. We, as advocates for migrant-rights and meaningful reform of our immigration system, have allowed two years of a constant barrage of lies, distortions, misinformation and bigotry, to essentially go unchecked.

Where is our counter to Lou Dobbs, who daily spouts out "facts" that have little basis in fact? Where is our FAIR or Center for Immigration Studies, who publish reams of dubious research and studies to further their cause? Where are all our talking-heads to fan out across the airwaves to counter right-wing spin? ….all these things don't exist, and as such the American people have been fed a daily dose of xenophobia and misinformation for over two years now. And now we ask, "How come we're losing this battle for hearts and minds"

According to polling sponsored by Democracy Corps, pollsters Greenberg Quinlan Rosner found that Democratic voters are most concerned about war and health care … but for independents it was "illegal immigration" and dependence on foreign oil.

For Democratic voters, being bogged down and spending billions in Iraq is the top issue (38 percent), followed closely by leaders having done nothing about health care (34 percent) and the loss of American jobs to China and India (29 percent).

For independents, the top issue underlying the discontent is ‘our borders’ having been ‘left unprotected and illegal immigration’ growing – cited by 40 percent, with no other issue a close second. The second most mentioned issue is ‘America doing nothing about our dependence on foreign oil and about global warming’ (31 percent).

Democrats: Finding Their Voices As Agents Of Change, Democracy Corps, Stan Greenberg ,Al Quinlan, and James Carville


And it is these independents that the strategists are most concerned with. Willingly pandering to their greatest fears and misconceptions.

Immigration and Welfare Reform

Critical to the success of the ‘New Democrats’ in 1992 was Bill Clinton’s pledge in his presidential announcement a year earlier to “end welfare as we know it.” It featured centrally in his campaign…

The centrality of illegal immigration to the current discontent about the direction of the country may be taking us back again to a welfare moment. Just as many workers with moderate incomes, uncertain employment and health insurance could not understand why they were being taxed to subsidize the long-term idleness of those on welfare, many Americans are just perplexed that this country has lost control of the borders and winks at illegal employment, taxing the resources of local schools and hospitals and much more. Many of the voter responses to welfare were racist to be sure, as now with the response to illegal immigration, but many are not.

How can George Bush, they ask have us on a “terror alert,” and yet he is “not really interested in doing anything about a barrier between Mexico and the United States”? “Isn’t it amazing?” “We’re under a big threat, but he won’t do anything about the borders.” Voters think this is just a first responsibility of leaders who are supposed to be protecting the country. Based on their votes on ‘homeland security,’ ports and the 9-11 Commission, Democrats agree with that first principle.

How can we be paying out government benefits and all this money when we are so financially strapped? Here, responses range from just sheer amount of money the country is paying for their support – “it taxes everything … twenty fold” – to the improbable belief that many are on welfare or food stamps and induced to say here. Some of these impressions conflict with the facts, but many speak concretely about hospitals that can’t deny health care and schools that must cope with the children and special language needs. For others it is more basic: “I’m self-employed “and couldn’t afford health insurance for a year. “We can’t afford to do anything because we’re paying for health insurance. They just go in and get it free.” The discussion of benefits leads to some pretty ugly responses, “Send the people back that don’t have [papers]. Our country has been too kind. I’m sorry.”

And with all the problems with jobs and the economy, how can you give over sectors of the American economy? Some do say that “tons of illegal immigrants in this country” are “doing a lot of jobs that nobody else wants to do.” But that is almost always contested in the groups: “I got boys that can’t find jobs, and I know high school kids that can’t find jobs because” the immigrants are willing to work many more hours for less. “Where is our jobs program for kids in [town] to dig those things out?” They think, not implausibly in some cases, “Let’s get control of what’s coming in and then there are jobs for our people.” With underlying worries about being forced to work at Wal-Mart, they think the illegal immigrants who work hard and for less “are driving the service industry out of our country.”

The voters most angry about the issue are those with a high school education, African Americans and those in rural areas, both black and white. This is also the top frustration for voters who want to vote Democratic for president but hold back from supporting our leading candidates. For all these target groups, their second frustration is ‘losing American jobs to China and India’ – part of a more general and poignant critique, why are our country’s business and political leaders not standing up for American workers and employees and more broadly, America.

Voters want control of the borders and workplace and recreating an immigration system that works and oppose driver’s licenses for illegal immigrants – positions supported by about two-thirds of the country. For them, that is the starting point, the common sense of the issue. If political leaders do not start there, they are not likely to be heard on other steps. But it is possible to build on those points to a progressive direction and comprehensive reform because people hold other views related to the issue.

• Many people talk about the impracticality of expelling the current ‘illegals’ and indeed, their importance to the economy: “The thing is that you can’t necessarily ship all of them out of here.”

• Despite comments about welfare and benefits, most talk about the immigrants as workers, indeed, hard workers with good values. They talk about business owners who describe them as “the hardest workers that my brothers have hired.” One woman in Colorado observed, “I had that honor, and I will actually say, it’s an honor because these people outworked every American citizen at this sweatshop that I worked at, except me.”

• Some recognize that you have to help the children: “The children shouldn’t have to suffer.”

• People are looking for a system not that excludes immigrants but regularizes the system to put people on a lawful basis. Instead of wasting money building a fence – “It’s just stupid. If we had a reasonable immigration policy we wouldn’t have the illegal immigration problem.” Others recognize the economy needs them but “we need some system in place” to make sure we are dealing with lawful people, not terrorists. While opposed to the impact on the service industry, one woman acknowledges: “People that come to this country have the right to come for a better life.” A majority of the country – unlike many in the world – believe legal immigration is positive for the country.

When we tested a comprehensive proposal in a bi-partisan poll for NPR, we got (44) percent support for a plan to increase enforcement on the borders and work place and deny most government benefits but recognizing we cannot expel 12 million, creates a path for citizenship for the law abiding – a big change in status with opportunities for fuller integration into America. That is likely a presidential issue that could gain further support with public debate. When we tested a plan earlier without the reassurance on benefits, the plan got only 39 percent, suggesting how challenging this issue will be for ordinary candidates without the full platform available at a presidential level. Even with the reassurance on control and benefits, 40 percent
of Democrats and a majority of African Americans favored the tougher Republican alternative that provided no path to legalization. This is a real wedge issue that Democrats need to get right.

But Democrats can get this right – genuinely attacking Bush for losing control of immigration, specifically, failing to manage the borders and no longer enforcing laws at the workplace. Democrats favor greater control and enforcement at the borders and restored penalties on employers for employing illegal workers. They would deny most government benefits, which is current law in almost all cases. Recognizing we can’t expel 12 million workers, Democrats accept some kind of legal status for those who are working, pay taxes
And are law-abiding – putting our values at the heart of the reforms that will further open up our society.

Voters are determined to vote for change and they want leaders who will work for the middle class, putting the interests of the public and country first, after the Bush years when leaders did not see the average person, when greed of executives and the self-interest of politicians determined our unfortunate course. That is the framework for Democrats to articulate their critique and progressive vision. The country wants to vote for change.

As anyone even vaguely familiar with the studies and research on immigration and its effects on both the economy and society can see, most of the "concerns" voiced in the focus groups are based upon misinformation and in some cases ignorance. From "welfare" and taxes to health costs and job loss, most if not all the opinions voiced by the focus group subjects were either blatantly false, or badly misinformed. But that really doesn't matter. People believe what they hear, and when they hear these "facts" spouted off day after day they become as good as real. It's the "big lie" theory of propaganda played out daily by right-wing politicians and their media allies.

As long as we, as immigration reform advocates, continue to fail at the crucial mission of shaping public opinion, we will continue to open the door for the kind of deception and self-serving pandering we now see coming from the DLC Democrats. We can rile against them all we want on matters of principle, but we know we are fooling ourselves if we actually believe that politics is currently moved by principle. It's moved by opportunity and power. And until we harness our own power to move this debate in a more positive direction we will continue to face defeat in the realm of public opinion, and with that abandonment by those who should be our allies.

There is one other important factor that needs to be taken into account when discussing the Democratic abandonment of meaningful immigration policy. Study after study shows that the Latino population will become the most important electoral demographic within the next few years. In states like New Mexico, Colorado, Arizona and Colorado, and Florida they may hold the key to 2008 victory.

But this power also seems to be going untapped. With the vicious Republican attacks on immigration issues, common wisdom has it that the Democratic Party will naturally be the beneficiaries of the Latino abandonment of that party. But should Latinos accept the DLC version of "Republican- lite" immigration policies? If this move to the right by the Democrats goes unchecked, what option does that leave? Latinos, and all other groups that contain large immigrant populations, need to come together and send a strong message that they will not be taken for granted. Their votes will not be won so cheaply. The Rahm Emanuels and James Carvilles of the world need to know that they should not be so quick to paint red states blue if in fact they expound views that are no different from their red state opponents.

We need to start to fight more effectively, we need to start to harness our power and direct it at countering the years of lies and propaganda promoted by the Republican Right. We need to let our Democratic "friends" know that they must hold true to the principles of equality, justice, and human-rights on which their modern party was founded …and if they fail that task…they are no better than their opponents....and should be given the same electoral consideration.


Read More...

Monday, October 15, 2007

New study shows undocumented immigrants good for Arizona economy

We can now add Arizona to the long list of states in which recent studies prove that the current influx of immigrants, both legal and undocumented, have contributed far more in taxes than they receive in government services.

Joining studies from California, Texas, Florida, New Mexico, Washington DC, and Long Island, NY, a new report from Udall Center for Studies in Public Policy at The University of Arizona looks at the contributions and costs of Arizona's immigrant population and finds not only an overall net gain for the state, but that the loss of this population would likely cause long term economic problems.

At a time when states like Georgia, Oklahoma and Colorado, and municipalities large and small all over the country, are passing harsh legislation intended to drive off their immigrant populations, this Arizona study concludes that, in the long run, these restrictionist tactics will end up creating economic disaster for certain segments of the economy and an overall loss for all residents. These finding don't bode well for the state which already has some of the toughest anti-immigrant laws in the nation.

The study is also unique in that it breaks out the non-citizen population from the rest of the immigrant population and still comes to the same overall conclusions.

This is a important development, since one of the restrictionsts chief weapons in their war of misinformation has been the lack of information on the contributions of the undocumented versus the larger immigrant population.

This has allowed them to wrongly discount or discredit many of the previous studies by claiming that undocumented are somehow different than the broader immigrant population in their use of services or contributions.

Based on this study, the total state tax revenue attributable to immigrant workers was an estimated $2.4 billion, of which about $1.5 billion came from for non-citizens. Balanced against estimated fiscal costs of $1.4 billion (for education, health care, and law enforcement), the net 2004 fiscal impact of immigrants in Arizona was positive by about $940 million.

The 2004 total economic output attributable to immigrant workers was about $44 billion, $29 billion of that coming from non-citizens. This output included $20 billion in labor and other income and resulted in approximately 400,000 full-time-equivalent jobs.

The study also looks at what impact the removal of as little as 10-15% of the immigrant workforce would have on the state's economy. Over $.5 billion in tax revenues would be lost, 125,000 jobs and $13.5 billion of lost economic output.

Clearly, lawmakers from statehouses to city councils across the country should examine this study before they begin to contemplate the adoption of restrictionist tactics and harsh legislation when addressing this issue. …..like the old saying goes:
"Be careful what you wish foror you just might get it."

Immigrants in Arizona: Fiscal and Economic Impacts
by Judith Gans
Udall Center for Studies in Public Policy at The University of Arizona.

Preface
Arizona’s foreign-born population has grown dramatically since 1990 when there were about 268,700 foreign-born persons in the state. By 2004, the foreign-born population had grown to 830,900. This is more than a 200 percent increase. The vast majority of these new immigrants are in the non-citizen category, which went from 163,300 to about 619,800, an increase of almost 280 percent. Most immigrants are of working age and have come to the United States seeking employment. This fact is central to their impacts in Arizona.

The likelihood that many of Arizona’s non-citizens are undocumented immigrants has fueled anger over lawlessness and made discussion of immigration in Arizona politically contentious. But Arizona’s experience is a specific case of a national problem, one that exists because large economic incentives in today’s global economy are overwhelming the U.S. immigration system – a system that is widely understood to be in need of reform. Public discourse that equates immigration and illegal immigration is narrowly focused and risks overlooking broader dimensions of the role of immigrants in the economy.

It is not the purpose of this study to address the myriad issues surrounding illegal immigration or to imply in any way that illegal immigration is not a problem. Rather, the objective of this study is to suspend, for the moment, discussion of this narrow topic and focus instead on a broader examination of all immigrants’ impacts on Arizona’s economic and fiscal health. By so doing, we hope to create a more thorough understanding of the economic costs and benefits of immigration and of the tradeoffs involved in setting and enforcing immigration policy.

In Brief

Arizona’s proximity to Mexico, the growth of its immigrant population, and the proportion of immigrants that are in the United States illegally have made immigration a contentious issue. This study is intended to step back from debates over illegal immigration and deepen our understanding of the costs and contributions of immigrants to Arizona’s economy.


Executive Summary

This report examines the costs and benefits of immigration in Arizona. It provides estimates of the of incremental fiscal cost associated with immigrants – education, health care, and law enforcement – and measures their contributions to Arizona’s economy both as consumers and as workers. The two categories of immigrants (naturalized citizens and non-citizens) are examined separately in order to disentangle the economic costs and benefits associated with each.

The bottom line

Based on this study, the total state tax revenue attributable to immigrant workers was an estimated $2.4 billion (about $860 million for naturalized citizens plus about $1.5 billion for non-citizens). Balanced against estimated fiscal costs of $1.4 billion (for education, health care, and law enforcement), the net 2004 fiscal impact of immigrants in Arizona was positive by about $940 million.

The 2004 total economic output attributable to immigrant workers was about $44 billion ($15 billion for naturalized citizens and $29 billion for non-citizens). This output included $20 billion in labor and other income and resulted in approximately 400,000 full-time-equivalent jobs.

Fiscal costs of immigration

Estimates of the incremental fiscal costs of immigration were derived from a variety of sources. In summary:

  • Education: For this analysis, English Language Learner (ELL) enrollment was used as a proxy for the number of immigrant children in Arizona’s public schools. The 2004 cost of ELL education in Arizona was about $540 million of which about $350 million (65 percent) was incurred in Maricopa County.


  • Health care: Total uncompensated care costs (reported as bad debt) for hospitals in Arizona was about $420 million, of which an estimated $150 million (32 percent) was incurred by immigrants. Of the $150 million in uncompensated care costs associated with immigrants, nearly $140 million was incurred by non-citizens.

    The total cost in 2004 of Arizona Health Care Cost Containment System (AHCCCS), Arizona’s Medicaid program, was $4.3 billion, of which an estimated $640 million was incurred by immigrants. Of the $640 million in AHCCCS costs associated with immigrants, about $480 million was incurred by non-citizens.


  • Law enforcement: In the area of law enforcement, the cost to the Arizona Department of Corrections of incarcerating immigrants in 2004 was $91 million, of which $89 million was for non-citizens.


Immigrants as consumers

As consumers, immigrants bring considerable spending power to Arizona’s economy. This spending contributes to Arizona’s overall economic performance, and, in turn, generates tax revenues for the state.

  • Jobs and income: Consumer spending in 2004 by naturalized citizen households in Arizona was an estimated $6.1 billion. Approximately 39,000 full-time equivalent jobs can be attributed to this spending along with $5.9 billion of output in the state’s economy.

    This output included labor income of $1.2 billion, and other income (defined as rents, royalties, dividends, and corporate profits) of $900 million.

    Consumer spending in 2004 by non-citizen households in Arizona was an estimated $4.4 billion. Approximately 28,000 full-time equivalent jobs can be attributed to this spending along with $4.3 billion of output in the state’s economy. This output included labor income of about $930 million, and other income (defined as rents, royalties, dividends, and corporate profits) of $560 million.


  • Tax revenues: Consumer spending in 2004 by Arizona’s naturalized citizens generated tax revenues of approximately $460 million, consisting of personal taxes of about $49 million, sales taxes of about $210 million, and business taxes of $190 million.

    Consumer spending in 2004 by Arizona’s non-citizens generated tax revenues of approximately $320 million, consisting of personal taxes of nearly $36 million, sales taxes of $150 million, and business taxes of about $130 million.
    Immigrants as workers

    Immigrants in 2004 were 14 percent of Arizona’s workforce, and were a larger proportion of low-skilled labor in agriculture, construction, manufacturing, and certain service industries. High-skilled immigrants were a large percent of the workers in specific areas of medicine and science.


In low-skilled occupations in Arizona:

  • Agriculture: Immigrants were 59 percent of the workforce in farming occupations and 22 percent of the workforce in food-preparation-and-serving occupations.

  • Construction: Immigrants were between 35 percent and 41 percent of the workforce in certain construction trades such as brick masons, flooring installers, and cement masons. They were 27 percent of the workforce in all construction trades.

  • Manufacturing: Immigrants were 35 percent of the workforce in food-related manufacturing, 46 percent of the workforce in textile-related manufacturing, and 22 percent of the workforce in metal-working manufacturing.

  • Service industries: Immigrants were 34 percent of the workforce in occupations providing services to buildings, 51 percent of the workforce in landscaping-services occupations, and 38 percent of the workforce in building-and-grounds maintenance. Immigrants were 26 percent of the workforce in traveler-accommodations occupations, 23 percent of the workforce in restaurant-and-food-serving occupations, and 33 percent of the workforce in private-household help.


In high-skilled occupations in Arizona:

  • Medicine: Immigrants were 38 percent of medical scientists and 19 percent of physicians and surgeons.

  • Science: Immigrants were 36 percent of astronomers and physicists, 16 percent of computer-hardware engineers, 18 percent of computer-software engineers, and 17 percent of electrical and electronics engineers. Immigrants were 15 percent of economists.


Economic contributions of immigrant labor

Approximately $15 billion, or four percent, of the state’s output can be attributed to naturalized citizen workers, resulting in about 120,000 full-time-equivalent jobs. This output included $4.9 billion in labor income and $1.9 billion of other income in the state. State tax revenues resulting from this economic activity were approximately $860 million.

Non-citizens, for their part, contributed about $29 billion, or eight percent of Arizona’s economic output, resulting in about 280,000 full-time-equivalent jobs. Their output included $10 billion in labor income, and $3.3 billion in other property income. The state tax revenues resulting from this economic activity were approximately $1.5 billion.

The role of immigrants as workers can be further understood by analyzing the potential consequences of this source of labor not being available. In other words, what would be the impacts if immigrant labor were removed from the economy?

To this end, this study used a series of computer simulations to examine the impacts of reduced immigrant labor on the industries that employ relatively large numbers of immigrants. The study focused on industries employing low-skilled, non-citizen workers because this is where recent growth in Arizona’s immigrant population has occurred and because we know that significant numbers of these workers are in the country without authorization. Thus, the simulations are designed to estimate the economic consequences of eliminating this segment of the workforce.

  • Agriculture: A 15-percent, immigrant-workforce reduction in the agriculture sector would result in direct losses of 3,300 full-time-equivalent jobs, and losses of about $600 million in output including lost labor income of about $200 million, and lost other income of about $110 million. The lost direct state tax revenue would be approximately $25 million.

  • Construction: A 15-percent, immigrant-workforce reduction in the construction sector would result in direct losses of about 56,000 full-time-equivalent jobs, and about $6.6 billion in output including lost labor income of about $2.6 billion and some $450 million in lost other income. The direct lost state tax revenue would be approximately $270 million.

  • Manufacturing: A ten-percent reduction in immigrants in the manufacturing workforce would result in direct losses of about 12,000 full-time-equivalent jobs, and about $3.8 billion in output including lost labor income of about $740 million, and lost other income of nearly $290 million. The lost direct state tax revenue would be approximately $100 million.

  • Service industries: In the service sectors analyzed, a 16-percent reduction in the immigrant labor force would translate to direct losses of 54,000 full-time-equivalent jobs, and lost output of $2.5 billion including reduced labor income of about $900 million, and reductions in other income of about $270 million. The lost direct state tax revenue would be nearly $160 million.


Net fiscal impacts of immigrants

Total state tax revenue attributable to immigrant workers was estimated to be about $2.4 billion ($860 million for naturalized citizens plus $1.5 billion for non-citizens). Balanced against estimated incremental fiscal costs of $1.4 billion, the net 2004 fiscal impact of immigrants in Arizona was positive, by approximately $940 million.

As 14 percent of the workforce, immigrants make significant contributions to Arizona’s economy. There are also specific fiscal costs associated with immigrants. But, by virtue of their contributions as workers to Arizona’s economic output, their overall contribution to the state’s fiscal health is positive. Certainly, these impacts are changing over time, but looking at data for one year provides a snapshot of the extent and magnitude of the role of immigrants in Arizona’s economy.

Note: We have estimated the incremental (marginal) costs of immigrants as individuals. If the immigrants were not present in Arizona, these costs would disappear. Immigrants’ impacts on costs of social services, such as fire and public safety protection, are not estimated because it is not possible to measure the incremental costs attributable to immigrants for these services.

Read complete report


UPDATE: 10/16/07: 7:30 EDT

Some questions have been raised at various other sites about two aspects of this study. One is the standard question about breaking down the numbers for just the undocumented population as oppossed to the non-citizen population as a whole.

The other questioning the extrapolations made about the economic costs of losing a portion of the undocumented workforce and the possible replacement of those workers with US-born workers.

the study answers both those questions:

How much of Arizona's immigrant population is here illegally?

We do not know. The U.S. Census does not ascertain legal presence in the United States when conducting its surveys and so the non-citizen category includes both legal and illegal non-citizen immigrants. However, there are reasonable, statistically derived estimates. Research by Jeffrey Passel at the Pew Hispanic Center indicates that, in 2002, there were between 250,000 and 350,000 unauthorized immigrants in Arizona, most of whom came from Mexico, and that by 2005 their numbers had increased to as many as 500,000.


Given these numbers it's statistically safe to estimate that somewhere around 80% of the non-citizen population is in fact undocumented in Arizona. This allows us to extrapolate the statistics given on the "non-citizen" population to see what's occurring with just the undocumented portion of that population.

As to the extrapolations made about the effects of the removal of the undocumented population on the economy and the likelihood that US-born workers would step up to fill the gap:

Our analysis to this point has focused on measuring the portion of Arizona's economic activity attributable to immigrants in its workforce. This raises the following question: would the jobs filled by immigrants be taken instead by native-born workers if immigrants were not part of the labor force in Arizona? The answer to this question is complex but largely depends on the availability of native-born workers with skills similar to Educational attainment data, both for Arizona and for the United States, indicate that immigrants and native-born workers tend to have different skills, with immigrants filling specific gaps in the native-born workforce by providing needed low-skilled and high-skilled workers. Immigrants in Arizona are an important source of low-skilled labor and of specific high-skilled labor that is relatively scarce in the native-born population and thus are vital to the total output of the industries that employ them. It is difficult to make the case that all or even most jobs filled by immigrants would, instead, be filled by native-born workers if immigrant workers were not available.


Read More...

Tuesday, May 15, 2007

New study looks at Hispanic immigration impact on Long Island

When talk turns to immigration and immigration reform more often than not the discussion will revolve around the border states or California with its large Latino population, or even the southeast where the recent influx of new immigrants has sparked backlash and controversy. But rarely do people think of traditional immigrant gateways like New York. Yet, every year New York is in the top three states for the number of foreign born residents both legal and illegal, and as anyone with even a cursory knowledge of the state can figure out, the bulk of those immigrants live in and around the NYC area.

Over the past 25 years, one region that has seen the greatest increase in immigrant population, and particularly in Latino immigrant population, has been Long Island. Originally a prototype for the mostly white, middle and working-class, suburban communities that sprung up in post-war America, Long Island has matured over time into a much more diverse, multi-ethnic, immigrant gateway. Today it is home to one of the fastest growing Latino populations in the nation made up of both new immigrants and native born.

A new study from the Horace Hagedorn Foundation and Adelphi University takes an in-depth look at over twenty five years of Latino immigration to Long Island and it's effects on the economic growth of the region.

In 1980, fewer than one out of every twenty Long Islanders was Hispanic. Today, the proportion is nearly one in eight. This rapid demographic change has resulted in increased ethnic tension and anti-immigrant sentiment. Suffolk County Executive Steve Levy recently made national headlines by sponsoring legislation that would make it illegal for businesses with contracts with the county to employ undocumented immigrants. Congressional Representative Peter King, one of the nation's most vocal opponents to immigration reform, co-sponsored last years House immigration bill, H.R. 4437, that sparked protests throughout the country.

While King and Levy pander to the lowest impulses of human nature, the new study, "The Economic Impact Of The Hispanic Population On Long Island, New York" from Mariano Torras, Ph.D.,of Adelphi University and economist Curtis Skinner, Ph.D. shows that rather than lowering the quality of life for Long Islanders, over 25 years of Latino immigration has brought great benefits.

The study takes a comprehensive look at how continuing immigration effects a mature “immigrant gateway”, focusing on the demographics and economic effects of Latino immigration in the area.

Executive Summary

Long Island’s Hispanic population has grown dramatically in recent years, led by new immigration from Latin America. Indeed, Hispanics have emerged as the major source of demographic growth for the region—excluding new Hispanic residents, Long Island would have lost, rather than gained, people since 1980. The new Hispanic presence is visible both in cities and villages with established Hispanic populations and in smaller and more remote communities, especially in Suffolk County.

As workers, consumers, entrepreneurs and taxpayers, Hispanics make important contributions to the Long Island economy. Hispanic residents add nearly $5.7 billion to total Long Island output as a result of their consumer spending. Hispanic employment continues to grow very rapidly—increasing by almost one third from 2000 to 2004 alone—and Hispanic workers are an important presence in diverse regional industries, including Manufacturing, Accommodation and Food Services, Landscaping Services and Construction. Hispanic-owned business is also booming in the region, posting almost $2 billion in sales in 2002. In addition, Long Island Hispanic residents contribute positively to local government budgets. This study finds that Hispanics contribute $614 more per resident to local revenues than they receive in local expenditures on education, health care and corrections.

The importance of Hispanic Long Islanders to the regional economy will only deepen as this population continues to grow in the years ahead. This study documents the extraordinary recent changes in the region’s Hispanic residents and describes the key demographic characteristics of this population. It then quantifies the Hispanic population’s contributions to production, employment and new business creation on Long Island. The report concludes by analyzing the Hispanic contribution to local government revenues and costs.

Among the study’s major findings:

Demographics: The Long Island Hispanic population tripled to nearly 330,000 residents since 1980, and it now represents approximately 12 percent of the general population.

  • The rate of increase was far greater than that for the Long Island population as a whole and significantly more rapid than the Hispanic population growth rate nationwide.


  • Immigrants from Central America, the Caribbean, and South America accounted for almost half of the growth in Long Island’s Hispanic population since 1980.


  • Sixty-five percent of Nassau County’s Hispanics lived in Hempstead town in the year 2000, while 68 percent of Hispanics in Suffolk lived in either Brookhaven or Islip.


  • Almost half of all Long Island Hispanics are in the “prime working age” category of 18 to 44, compared to only a little more than one third of all Long Islanders.


Entrepreneurship: From 1997 to 2002, the number of Hispanic-owned businesses in Long Island rose by almost 35%, and total sales and receipts by 21%.

  • Growth was especially strong in Suffolk County, where the number of firms increased by 51% and sales by 39%.


  • Long Island Hispanic-owned businesses earned almost $2 billion in sales and receipts, and employed an estimated 25,000 people.


Economic Impact: Long Island’s Hispanic population contributed an average of $614 more per resident than it received in local expenditures on education, health care and corrections.

  • The buying power of Long Island Hispanics in 2004 amounted to $4.4 billion. Hispanic spending produced an economic impact of nearly $5.7 billion—of which more than $3.2 billion was in Suffolk County—and created more than 52,000 jobs.


  • In 2004 Hispanics contributed about $925 million in taxes and other government revenues (directly and indirectly), while costing Nassau and Suffolk local governments (counties, towns/cities, villages and school districts) about $723 million for K-12 education ($520 million), health care ($158 million), and corrections ($45 million). The net benefit to Long Island was about $202 million.


The Economic Impact Of The Hispanic Population On Long Island, New York, Horace Hagedorn Foundation

Read More...

Sunday, April 8, 2007

Immigration News Roundup: April 2 – April 8

This week brought the formal announcement by Tom Tancrazy that he will in fact make a run for the Republican presidential nomination. ICE released some numbers on the results of "Operation Return to Sender", the nationwide crackdown intended to catch criminal undocumented immigrants. Not surprisingly, over one third of those taken into custody were not intended targets, but rather "collateral arrests" made of those who were in the wrong place at the wrong time.

Census data revealed that immigration is crucial to maintaining growth in many major
US metropolitan areas.

With this years income tax filing date quickly approaching, tax preparation chains are dealing with record numbers of undocumented immigrants wishing to file tax returns.

A newly released surveillance video of a migrant shooting in Arizona by a Border Patrol Agent casts doubt on the veracity of his account of the incident. It appears that what he claimed was self defense now looks more like an execution style killing.

Lastly, we look at this past weekend's immigration march in LA.

  • Tancredo Makes it Official: Announces Presidential Run

  • Immigration Raids Yield Thousands of "Collateral Arrests"

  • Immigration Crucial to Sustaining Metro Populations

  • Undocumented Immigrants File Taxes in Record Numbers

  • Video Reveals Details of Migrant Shooting by Border Patrol

  • Thousands March in LA for Immigrant Rights


Tancredo Makes it Official: Announces Presidential Run

Citing a tough immigration stance, Tancredo announces presidential bid

Criticizing other GOP candidates as weak in their efforts to stop illegal immigration, Colorado Rep. Tom Tancredo announced Monday he would seek the Republican presidential nomination.

‘‘The political elite in Washington have chosen to ignore this phenomenon,’’ he said.

Tancredo, a congressman who has gained prominence in recent years for his staunch stance against illegal immigration, said immigration would be the primary focus of his campaign.

He said he would not enter the race if he thought one of the leading candidates was sufficiently conservative on the issue..
Times-Republican

Tancredo campaign: more scare tactics

Call Tom Tancredo the no-chance candidate, a one-trick pony.

While he may not be a real contender, the Colorado congressman has a million dollars and a dream: to push the issue of undocumented immigration to the forefront of the 2008 presidential campaign.

It's the sole reason he's running for prez.

In many ways Tancredo is like Al Sharpton, the Democratic challenger of the '04 race who knew he couldn't win but used his platform to talk in no-nonsense fashion about civil rights issues.

You have to admire someone who is passionate about an issue, even if you disagree with him. But Tancredo borders on the obsessive. It's evident in his actions.

He's hung out along the Mexican border with gun-toting "Minutemen" vigilantes who dress in camouflage and wear night-vision goggles.

At a California rally he held up a T-shirt emblazoned with the words "America is full."

He said Miami, a city that is majority Latino, resembles a "third-world country."

And in South Carolina he didn't mind speaking in a room draped with Confederate battle flags, where men dressed in Confederate regalia sang "Dixie," an offensive song that came out of blackface minstrel shows of the 1850s, mocking freed slaves.

It's understandable why Esquire magazine called him "Tancrazy."
Denver Post

Related:
Candidate Tancredo welcomed times 2, Denver Post

Tancredo joins GOP race on immigration platform, Chicago Tribune


Immigration Raids Yield Thousands of 'Collateral Arrests'

Immigrant crackdown brings 6,696 'collateral arrests'

More than one-third of 18,000 people arrested in a nearly yearlong federal crackdown on illegal immigrants were not the people authorities had targeted, according to government figures.

The so-called collateral arrests involved people picked up by immigration agents seeking fugitives such as drug smugglers, thieves, drunken drivers and others who flouted deportation orders.

When tracking down fugitives, authorities visit a suspect's last known address and often find other immigrants, who are then asked to prove they are legally entitled to live in the United States.

Supporters of such tactics say the government is just doing its job after years of neglect.

...snip…

Critics say the campaign against fugitive illegal immigrants ensnares many hard-working people who are in the country illegally but do not pose a danger.

"They're trying to sell it as something where they target [criminals] but it's become part of a larger dragnet," said Pedro Rios, director of the American Friends Service Committee's office in San Diego.

Dubbed "Operation Return to Sender," the crackdown began last May in cities nationwide. As of Feb. 23, it had resulted in 18,149 arrests of suspected illegal immigrants, most of whom were captured at home and in Hispanic neighborhoods.

But, according to figures from Immigration and Customs Enforcement, nearly 37 percent of those cases, or 6,696 arrests, were "collateral" captives -- people who just happened to be present when agents arrived. Such arrests account for more than half the total in four cities: Dallas and El Paso, Texas (59 percent); New York (54 percent); and San Diego (57 percent).
San Diego Tribune

Related:
Crackdown on Fugitives Nets Many Arrests, Washington Post

Religious leaders want end to raids' 'collateral arrests', San Diego Union Tribune

Agents step up immigrant searches, San Diego Union Tribune

359 arrested in Calif. immigration sting, Houston Chronicle

Mount Kisco immigration raids are among many across U.S.The Journal News


Immigration Crucial to Sustaining Metro Populations

Census: Immigration Helps Big Metros Grow

Without immigrants pouring into the nation's big metro areas, places such as New York, Los Angeles and Boston would be shrinking as native-born Americans move farther out.

Many smaller areas, including Battle Creek, Mich., Ames, Iowa, and Corvallis, Ore., would shrink as well, according to population estimates to be released Thursday by the Census Bureau.

"Immigrants are filling the void as domestic migrants are seeking opportunities in other places," said Mark Mather, a demographer at the Population Reference Bureau, a private research organization.

Immigrants long have flocked to major metropolitan areas and helped them grow. But increasingly, native-born Americans are moving from those areas and leaving immigrants to provide the only source of growth.

The New York metro area, which includes the suburbs, added 1 million immigrants from 2000 to 2006. Without those immigrants, the region would have lost nearly 600,000 people.

Without immigration, the Los Angeles metro area would have lost more than 200,000, the San Francisco area would have lost 188,000 and the Boston area would have lost 101,000.

The Census Bureau estimates annual population totals as of July 1, using local records of births and deaths, Internal Revenue Service records of people moving within the United States and census statistics on immigrants. The estimates released Thursday were for metropolitan areas, which generally include cities and their surrounding suburbs.
Washington Post

Related:
Census Shows Immigration Helping St. Louis Schools, KSCK News5

Very low growth seen by census, The Republican, MA


Undocumented Immigrants File Taxes in Record Numbers

Even illegal immigrants in U.S. pay taxes

On a recent Sunday afternoon, construction workers, car washers, truck drivers and students crowded into Petra Castillo's one-room tax-preparation office in this city's South Central neighborhood. Most of those inside what was once the home of El Jefe Tacos shared something besides their need to beat this year's April 17 filing deadline: They are illegal immigrants.

…Politicians and activists campaigning for a crackdown on illegal immigration frequently complain that the nation's estimated 12 million undocumented residents violate U.S. law by not paying taxes, as well as by being in the U.S. without permission. But . Castillo's booming business shows how some of the workers who are here in defiance of one arm of the U.S. government - the Department of Homeland Security - are filing federal tax returns with the aggressive encouragement of another - the Internal Revenue Service.

"If someone is working without authorization in this country, he or she is not absolved of tax liability," IRS Commissioner Mark Everson, a former immigration official, said in testimony before Congress last year. Last week, speaking to the National Press Club, he added, "We want your money whether you are here legally or not and whether you earned it legally or not."

In 1996, the IRS created the individual taxpayer identification number, or ITIN, a nine-digit number that starts with "9," for taxpayers who didn't qualify for a Social Security number. Since then, the agency has issued about 11 million of them, and by 2003, the latest year with available figures, the number of tax returns using them had risen to nearly one million. The government doesn't know how many of those taxpayers were undocumented immigrants. Foreign nationals with tax-reporting requirements in the U.S. can also get an ITIN. But most of the people who use the number are believed to be in the U.S. illegally. All told, between 1996 and 2003, the income-tax liability for ITIN filers totaled almost $50 billion.

As part of its outreach effort, the IRS has been helping taxpayers apply for ITINs through partnerships with community groups. Last week, the Center for Economic Progress, a nonprofit group in Chicago, hosted its fourth ITIN event of the tax season at a church on the city's South Side, helping individuals apply for the number and file in one sitting.
Wall Street Journal, via Arizona Republic

Related:

Tax Prep Chains Attract Immigrants , Washington Post

Illegal immigrants filing taxes more than ever, AP


Video Reveals Details of Migrant Shooting by Border Patrol

Video of entrant's killing is released, Blurry tape fails to back account related by agent

Video taken by a surveillance camera of the fatal shooting of an illegal entrant by a Border Patrol agent appears to cast more doubt on the agent's account of the incident.

A copy of the video was released Tuesday by the Cochise County Attorney's Office. This follows Monday's release of a 300-page report on the Jan. 12 shooting.

The video shows from a distance the moments of the fatal shooting of Francisco Javier Domínguez-Rivera by Border Patrol Agent Nicholas Corbett. The incident happened in the afternoon near the border between Douglas and Bisbee.

The blurry digital video shows Corbett getting out of the driver's side of his vehicle and moving around the back before engaging a group of people, Cochise County sheriff's Sgt. Mark Genz wrote in a report given to the county attorney.

"You can see that he is very close to several subjects. It appears that one of the subjects he is near goes down partly, possibly to his knees and then goes down to the ground all the way and you lose sight of him," he wrote.

…snip…

The County Attorney's Office sent the video to the FBI to see if the bureau can enhance the quality of the footage.
Cochise County Attorney Ed Rheinheimer said he is waiting to review an enhanced version of the video before deciding whether to charge Corbett.

Corbett, 39, didn't speak to investigators during the investigation but reportedly told colleagues he fired a single shot from the front of his vehicle at a man who was at the back of his vehicle who looked like he was going to throw a rock.

An autopsy report and other forensic evidence seem to support the matching account from three witnesses, including the dead man's two brothers, who told investigators the agent fired while pushing Domínguez-Rivera to the ground.

The Cochise County Medical Examiner's Office found that a single bullet entered the left side of Domínguez-Rivera's chest and followed a downward trajectory through his heart and liver before lodging in his abdomen.
The shot was fired from between 3 inches and 2 1/2 feet away, according to Arizona Department of Public Safety lab information included in the report. The bullet casing from Corbett's gun was recovered.
Arizona Star

Related:
Border Patrol agent's account of shooting doesn't match evidence, Scipps

Agent Who Killed Immigrant Back on Duty, San Francisco Chronicle

Records contradict agent's story on entrant's slaying, Arizona Star

Witnesses: Agent shot unarmed man while pushing him to ground, Douglas Daily Dispatch


Thousands March in LA for Immigrant Rights

L.A. pro-immigrant march draws thousands

Thousands of people, many wearing red, marched peacefully Saturday through downtown Los Angeles, calling for broad amnesty for illegal immigrants.

Police estimated that about 7,000 to 10,000 people participated in the march. Two demonstrations two weeks ago, both held to commemorate last year's massive Los Angeles march, were marked by low turnout.

Organizers said Saturday's noontime event, which began at Olympic Boulevard and Broadway and ended at City Hall, was designed to rejuvenate efforts in Washington to promote reform that offers a path to citizenship to the greatest possible number of undocumented immigrants. Such efforts have stalled in Congress.

It was also intended to prove to critics that the immigrant rights movement was not dead, organizers said.

"People would like for it to go away," said Juan Jose Gutierrez of Latino Movement USA, one of the coordinators of the march. Speaking of Congress, he said, "we are not going to go away until they act responsibly.".
LA Times


tags: , , , , ,

Read More...

Tuesday, October 24, 2006

New Analysis of Undocumented Immigration by Congressional District

The American Immigration Law Foundation has released new analysis of the 2005 American Community Survey from the US Census Bureau. Breaking down the number of undocumented immigrants for each congressional district, and their percentage of population, the study compares statistics from 2000 and 2005, looking at which districts saw the greatest increases and decreases in undocumented population during the period.

Over the past year, Congress has debated major changes to immigration law as a response to undocumented immigration. While this debate has relied heavily upon estimates of undocumented immigration at the national level, less attention has been paid to the number of undocumented immigrants in local areas—and almost no analyses have considered the size and scope of undocumented immigration in each of the 435 congressional districts. Yet the size of the undocumented population in each congressional district is an important consideration in gauging whether or not a representative’s stance on a particular immigration policy or initiative has a basis in the actual, local impact of undocumented immigration.

ALIF, Immigration Policy Brief

An earlier IPC analysis " Playing Politics on Immigration: Congress Favors Image over Substance in Passing H.R. 4437" used the 2000 census numbers to see the correlation between those who voted for the enforcement-only immigration bill passed by the House and the undocumented populations in their districts. The study showed that the number of undocumented immigrants was surprisingly low in the districts of key representatives who supported the bill.

Not surprisingly, this new analysis confirms the findings of the previous study. Representatives with the smallest percentage of undocumented immigrants in their districts tended to be some of the most rapid supporters of restricting immigration. In some cases their districts actually had the same number or fewer undocumented immigrants in 2005 than they did in 2000 despite national trends to the opposite.


tags: , , , ,

WI-05, the home district of Judiciary Chairman James Sensenbrenner (R), sponsor of HR4437, saw no increase in undocumented immigrants over the five year period. His district held steady at 4,000 undocumented immigrants. At 0.6% of population it was one of the lowest in the nation and far below the 3.88% national average.

Co-sponsor of the bill, Peter King (NY-03) actually saw his district lose undocumented population over the study period. In 2000, his district had 9000 undocumented immigrants, or 1.4% of population. By 2005 that number decreased by 22% to 7000 or 1.1% of population. This represented by far the smallest number of undocumented immigrants in any down-state New York district where many districts have well over 50,000 undocumented immigrants in residence.

Another district that lost undocumented population was IA-05. This district, represented by Steven King(R) who early this year led the effort to block the renewal of the 1965 Voting Rights Act on the grounds that it contained provisions for bi-lingual ballot and voting information, lost 1000 undocumented residents over the period. The loss brought the number down to 6000, or 0.9% of population.

Over the last five years over 3 million undocumented immigrants entered the country; nationally the increase represents a 40% increase. Yet in many of the districts represented by the most ardent proponents of closed borders, criminalization of the undocumented and restrictions on further immigration, the increased undocumented population falls far below the national average.

Conversely, in the AILF's earlier analysis, representatives from those districts with the greatest percentage of undocumented immigrants tended to vote against HR4437 and favored a more comprehensive form of immigration legislation. This is confirmed again in the new analysis of the 2005 data.

It has been speculated from the start that the "immigration crisis" has far more to do with political expedience than true concern for real reform of the broken immigration system. It is no small wonder that after more than a year of banging the immigration drums the House Republicans have yet to deliver any real reform or legislative success. When viewed in light of the actual numbers it becomes obvious that the immigration issue has far more to do with demagoguery than demographics.

The complete findings of the analysis can be viewed here

Read More...

Thursday, August 31, 2006

New evidence of immigrant's growing political power.

Anticipating a heated campaign season where immigration reform is bound to be a major issue, immigrant's rights groups have spent much of the summer working on voter registration in hopes to counter the ever increasing anti-immigration rhetoric coming from the right. It now appears their work may not be for naught.

A new study released Wednesday by the Illinois Coalition of Immigrant and Refugee Rights (ICIRR) looked at the political ramifications of the changing demographics of the Prairie State, and warned that, "Political parties that are identified with anti-immigrant rhetoric in Illinois or that engage in anti-immigrant demagoguery for short term political gain will consign themselves to permanent political minority status in Illinois."

Based on the recently released U.S. Census figures for 2005, the research brief, titled “Marching Towards the American Dream: Illinois Immigrant Citizens Settle in Chicago Suburbs” found that immigrants are fast becoming the critical voting block in Chicago’s suburbs and much of Illinois.


tags: , , , , ,


Almost all of the immigrant growth took place in the suburbs, where the 5 year population growth of immigrants was 193,000 people, a significant 24% increase. Even more significant politically was the stunning growth of suburban immigrants who are naturalized U.S. citizens. There are now some 460,000 naturalized citizens in the Chicago suburbs, a 38% increase over just 5 years ago. In DuPage County the number of immigrant citizens jumped from 61,051 to 91,234, an astounding 49% increase in just 5 years.

Immigrants and their U.S. born children are the new “swing” voters in the hotly contested suburban Congressional seats. They now comprise 44% of the population in the west suburban 7th Congressional District being vacated by Cong. Henry Hyde; 40% of Cong. Mark Kirk’s 10th CD; and 33% of Cong. Melissa Bean’s 8th CD. In addition, Cong. Dennis Hastert’s 14th CD is now 30 % immigrants and their children.
Link (MS Word doc)

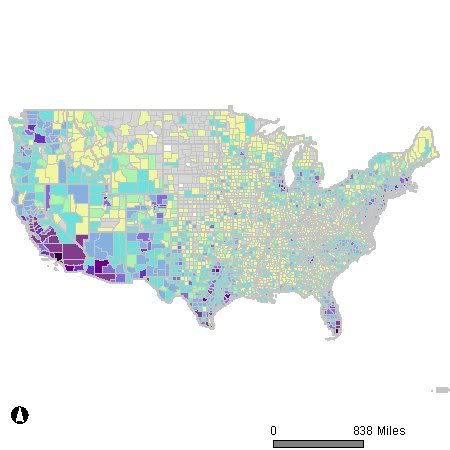
The study further confirms a national trend that shows much of the increase in foreign-born population in the last ten years has taken place outside of the urban centers that were the traditional home to large immigrant populations. This trend was first documented in the 2000 Census which showed a shift of the foreign born population into more rural and suburban areas, particularly in the South and Midwest.

According to author of the report, Joshua Hoyt, executive director of ICIRR, this population shift is significant because the traditionally Republican strongholds of the suburbs are now competitive for Democrats.

"We're riding the crest of a tsunami," said Hoyt, "Immigrants in Illinois are achieving the American dream of learning English, becoming American citizens and settling in the suburbs with their children.

"Immigrants are the new swing voters, the new soccer moms and NASCAR dads."


And while Chicago is often heralded as a city of immigrants, its total foreign-born population actually dipped 5 percent in the last five years, the first such drop during the wave of immigration that began in 1965.

Most important politically is the rise in the number of immigrants who have become U.S. citizens, making them eligible to vote. In the last five years the number of naturalized citizens in Illinois rose 23.1 percent, to 736,161.

But the real growth has been in the suburbs.

While Chicago only experienced a 4 percent increase in naturalized citizens of voting age during the period, the suburbs saw a boom of 37.5 percent.
Chicago Sun-Times

Hoping to capitalize on this demographic shift, this past summer a coalition of immigrant's rights groups launched the "We Are America" campaign in an effort to "increase the numbers of immigrant citizens and voters by one million for the 2008 elections" nation-wide.

In Illinois, the ICIRR, in partnership with the Employees International Union (SEIU) launched the “New Americans Democracy Project.” The project managed to register 8,000 new voters over the past eight weeks, on top of the 33,000 registered in 2004 and 2005.

The introduction to the report gives a warning to those who continue to use the debate over immigration reform for quick political gain:

"Immigrants are marching towards their American Dream: learning English, becoming citizens in record numbers, and settling down in the suburbs. The stunningly high numbers of new Americans moving to the suburbs and the large number of their U.S. born children is fundamentally changing the political landscape of our state, because they can all vote!

Politicians who ignore the pressing need for immigration reform in Illinois, including family reunification and a path to earned citizenship for the undocumented, now ignore huge numbers of their own constituents. Key “swing” Congressional Districts in Chicago’s suburbs (including those of Congressmen Hyde, Kirk, and Bean) are competitive for Democrats because of new immigrant voters. Political parties that are identified with anti-immigrant rhetoric in Illinois or that engage in anti-immigrant demagoguery for short term political gain will consign themselves to permanent political minority status in Illinois."

"We are in a time when politicians like Illinois’s Dennis Hastert, Speaker of the U.S. House of Representatives, believe they can exploit anti-immigrant feeling for cheap political gain,” said Hoyt, “But politicians in Illinois need to be aware that immigrants and their children are now the key swing vote in the key battleground districts for Congress.”

ICIRR President Juan Salgado adds that "it is time for Speaker Hastert to move past stale partisanship and work for bi-partisan solutions.”


Key findings of the Research Brief included:

  • Immigrants are now 13.6% of the population in Illinois; Immigrants and their children are 26% of the population. The immigrant population of Illinois grows by 35,300 people a year.

  • There are 1.5 million U.S. born children of immigrants in Illinois; 870,000 of them are voting age.

  • The number of immigrant naturalized citizens in Illinois jumped from 597,911 in 2000 to 736,161 in 2005, a 23% increase in just 5 years. The number of suburban naturalized citizens jumped 38% in just the last 5 years, and now totals 460,000.

  • There are now 1,605,844 voting age naturalized citizens and U.S. born children of immigrants in Illinois, 19% of the entire citizen voting age population. Each year 18,000 U.S. born children of immigrants become eligible to vote.

  • The immigrant population of 984,000 in the suburbs now dwarfs the Chicago immigrant population of 590,000.

  • Immigrants and their U.S. born children are over half of the constituents in the Congressional Districts of Cong. Gutierrez (04), Emmanuel (05), and Schakowsky (09); over a third of the population in the districts of Cong. Lipinski (03), Hyde (06), Bean (08), Kirk (10), Weller (11), and over a quarter of the districts of Cong. Biggert (13) and Hastert (14).

  • Immigrants are rapidly becoming U.S.citizens in key suburban districts. In just the 5 years from 2000 to 2005 there was a 59% increase in the number of immigrant citizens in the Congressional District of Cong. Hastert; 57% increase in Cong. Bean’s district; 51% increase in Cong. Hyde’s district; and 32% increase in Cong. Kirk’s district.

  • Illinois is now home to almost 700,000 Mexican immigrants; the next greatest populations of immigrants are Polish, Indian, Filipino, and Chinese.

  • The Indian population of Illinois increased 24% in just 5 years; the Filipino community increased 19%; and the Chinese population increased 18%.


  • Read More...

    Friday, August 4, 2006

    Honk for English: Fun with maps & hypocrisy

    The Modern Language Association has posted a new version of their interactive US language map. Given the current interest in certain political circles about exactly what languages should be allowed to be spoken in the US and an obsession with those who might speak languages other than English, this excellent interactive tool presents an opportunity to really see what all the hubbub is all about.

    The map allows you to breakout any of the 33 different major languages spoken in the US by region, state or even county. With a little extrapolation one is able to find hidden ethnic enclaves or patterns of mass migration. Most importantly for our purposes, it lets us see exactly where all these non-English speakers that are causing such concern are located … or more importantly where they're not.


    tags: , , , ,


    Before we begin our little journey into the world of linguistics, a little background information might be in order. In May, during the height of the debate over immigration reform in the Senate two dueling amendments were added to the Senate legislation dealing with English as a national language. One amendment, sponsored by and passed the Republican majority, made English the "official language" of the United States and stated that " no person has a right, entitlement, or claim to have the Government of the United States or any of its officials or representatives act, communicate, perform or provide services, or provide materials in any language other than English." A second amendment was immediately added to supercede the first. Sponsored by Democrats and passing with bipartisan support, the second amendment made English the "common and unifying language of America" and made sure that "nothing herein shall diminish or expand any existing rights under the law of the United States relative to services or materials provided by the government of the United States in any language other than English."

    Not willing to lay down the torch of language purity quite so easily, a month later House Republicans took up the fight. This time it was in the form of a threat by 79 Republican Representatives to block the renewal of the Voting Rights Act of 1965 if its requirements for bilingual voting materials were not removed from the landmark legislation. Eventually, realizing the impending public relations nightmare if the Act were to stall out, enough Republicans came on board and the Act was renewed. Yet, 33 House Republican still voted against the renewal.

    What does this have to do with the linguistic map? …

    A little general information is needed first.

    Just under 47 million people speak a language other than English in the US according to the latest census figures. That comes out to 18% of the population.


    28,101,052 10% Spanish or Spanish Creole
    2,022,143 0.77% Chinese
    1,643,838 0.63% French (incl. Patois, Cajun)
    1,383,442 0.53% German
    1,224,241 0.47% Tagalog
    1,009,627 0.38% Vietnamese
    1,008,370 0.38% Italian
    894,063 0.34% Korean
    706,242 0.27% Russian
    667,414 0.25% Polish
    614,582 0.23% Arabic
    564,630 0.22% Portuguese or Portuguese Creole
    477,997 0.18% Japanese
    453,368 0.17% French Creole
    418,505 0.16% African languages
    365,436 0.14% Greek
    317,057 0.12% Hindi
    312,085 0.12% Persian
    262,900 0.10% Urdu
    235,988 0.09% Gujarathi
    233,865 0.09% Serbo-Croatian
    203,466 0.08% Other Native North American languages
    202,708 0.08% Armenian
    195,374 0.07% Hebrew
    181,889 0.07% Mon-Khmer, Cambodian
    178,945 0.07% Yiddish
    178,014 0.07% Navajo
    168,063 0.06% Miao, Hmong
    162,252 0.06% Scandinavian languages
    149,303 0.06% Laotian
    120,464 0.05% Thai
    117,973 0.04% Hungarian

    As far as the distribution of these foreign language speakers goes, it doesn't take a demographer to figure out that different areas of the country have far different concentrations of non-English speakers. California for example has a 40% non-English speaking population, New York - 28%, New Jersey -26%, and Texas – 32%. On the other hand, West Virginia has only 3% of its population speaking a language other than English, Montana – 6%, Iowa -6%.

    Lets take a look at how these percentages of non-English speakers corresponds with the states that have produced the most vocal proponents of English-only initiatives in Congress.

    Sen. James Inhofe (R-OK) – sponsor of the English as national language amendment in the Senate – 8% non-English speakers (7.4% if you discount Native American Language Speakers) - a full 10% lower than national average.

    Rep Steve King (R-IA) – Sponsor of the effort to block the Voting Rights Act – 6% non-English speakers. In fact the majority of those House members supporting King's effort to remove the bilingual provisions of the Voting Rights Act came from states with below average numbers of non-English speakers. Only 15 of the 55 original signatories of Kings letter to the Judiciary Chairmen about the VAR came from states with above average numbers of non-English speakers.


    Rep. Peter King (R-NY) – 28%
    Rep. Steve King (R-IA) – 6%
    Rep. Todd Akin (R-MO) – 6%
    Rep. Rodney Alexander (R-LA) – 10%
    Rep. Gresham Barrett (R-S.C.) - 6%
    Rep. Roscoe Bartlett (R-MD) – 13%
    Rep. Marsha Blackburn (R-TN) – 32%
    Rep. John Boozman (R-AR) – 5%
    Rep. Jeb Bradley (R-NH) – 9%
    Rep. Ginny Brown-Waite (R-FL) -16%
    Rep. Henry Brown (R-SC) -6%
    Rep. Dan Burton (R-IN) -7%
    Rep. Steve Buyer (R-IN) – 7%
    Rep. Ken Calvert (R-CA) -40%
    Rep. John Campbell (R-CA) -40%
    Rep. Howard Coble (R-NC) -9%
    Rep. Barbara Cubin (R-WY) -7%
    Rep. John Culberson (R-TX) -32%
    Rep. Jo Ann Davis (R-VA) -12%
    Rep. Nathan Deal (R-GA) -10%
    Rep. John Doolittle (R-CA) -40%
    Rep. John Duncan (R-TN) -5%
    Rep. Scott Garrett (D-NJ) -26%
    Rep. Virgil Goode (R-VA) -12%
    Rep. Louis Gohmert (R-TX) -32%
    Rep. Phil Gingrey (R-GA) -10%
    Rep. Bob Goodlatte (R-VA) -12%
    Rep. Sam Graves (R-MO) -6%
    Rep. Gil Gutknecht (R-MN) -9%
    Rep. J. D. Hayworth (R-AZ) -26%
    Rep. John Hostettler (R-IN) -7%
    Rep. Bob Inglis (R-SC) -6%
    Rep. Ernest Istook (R-OK) -8%
    Rep. William Jenkins (R-TN) -5%
    Rep. Walter Jones (R-NC) -9%
    Rep. John Kline (R-MN) -9%
    Rep. Ray LaHood (R-IL) -20%
    Rep. Steven LaTourette (R-OH) -7%
    Rep. Donald Manzullo (R-IL) -20%
    Rep. Gary Miller (R-CA) -40%
    Rep. Jeff Miller (R-FL) -16%
    Rep. Sue Myrick (R-NC) -9%
    Rep. Ron Paul (R-TX) -32%
    Rep. Collin Peterson (D-MN) -9%
    Rep. Todd Platts (R-PA) -9%
    Rep. Tom Price (R-GA) -10%
    Rep. Jim Ramstad (R-MN) -9%
    Rep. Dana Rohrabacher (R-CA) -40%
    Rep. Ed Royce (R-CA) -40%
    Rep. Jim Ryun (R-KS) -9%
    Rep. Pete Sessions (R-TX) -32%
    Rep. Bill Shuster (R-PA) -9%
    Rep. Tom Tancredo (R-CO) -16%
    Rep. Curt Weldon (R-PA) -9%
    Rep. Roger Wicker (R-MS) -4%

    We have know for quite some time that many of those who voice the loudest opposition to immigrants rights and comprehensive reform come from areas least effected by growing immigrant populations. The American Immigration Law Foundation did an excellent study of the voting patterns of those House members who voted for HR4437 and found that Representatives from district with few undocumented immigrants supported the bill while those with large undocumented populations opposed it.


    Representatives From Districts With Fewer Than 5,000 Undocumented Immigrants Were Most Likely To Support The Bill

    There are 96 congressional districts that have fewer than 5,000 undocumented immigrants. Most of these districts are largely rural and located in sections of Appalachia, the Midwest, and the Mississippi Valley that are experiencing little economic growth and low levels of immigration in general. Constituents in many of these districts face tough economic times, but the cause is not immigration. Immigrants are attracted to regions of economic dynamism and job expansion. This is why greater numbers of undocumented immigrants are found in western states that have agricultural, livestock, fishing, and tourist economies that need the kinds of less-skilled labor that undocumented immigrants often provide.

    Undocumented immigrants in the 96 lowest-immigration districts make up no more than 0.8 percent of the population (each of the 435 congressional districts has roughly the same total population: about 650,000 as of 20001). The votes on H.R. 4437 in these districts tell you something about immigration politics in the United States today. The supposed threat from undocumented immigration is enough to rally voters and move levers of power even in areas where the actual impact is minuscule. Among representatives from districts with the smallest populations of undocumented immigrants, 74 percent (71 out of 96) voted for the bill: 90 percent of Republicans (56 out of 62) and 44 percent of Democrats (15 out of 34)


    Representatives From Districts With More Than 50,000 Undocumented Immigrants Were Most Likely To Oppose The Bill

    The voting pattern of the representatives from the 61 congressional districts with 50,000 or more undocumented immigrants tells a different story. These districts for the most part are located in densely populated urban areas such as New York City, Chicago, and Los Angeles, and are relatively small in geographic size compared to rural districts that include many counties. In these high-immigration districts, the undocumented alone can account for as much as one-fifth of the total population. As a result, representatives who hail from these areas are familiar with undocumented immigrants and their impact on local communities. Among representatives from districts with the largest populations of undocumented immigrants, a mere 5 percent (3 out of 61) supported the bill: none of the 53 Democrats and only 3 of the 8 Republicans.

    The inverse relationship between support for H.R. 4437 and the actual presence of undocumented immigrants in a representative’s district represents a widespread voting pattern. Among all Democrats, those who voted in favor of the bill had roughly 10,000 undocumented immigrants in their districts. Democrats who opposed the bill, on the other hand, had about 37,400. Among all Republicans, the same pattern holds: those voting for H.R. 4437 had an average of 14,500 undocumented immigrants in their districts, while those who voted against the bill had an average of 30,800


    Link

    While playing around with the MLA linguistic map is neither as scientifically sound or comprehensive as the study done by AILF, it yields pretty much the same results and in fact is quite educational. I was not aware that there was an enclave of Yiddish speakers in central Washington State, or that there was a growing Filipino community in South Texas. For those with more ambition than I, it would be interesting to see the exact linguistic makeup of the various districts of House members who are most vocal about immigration. While I’m pretty sure we know the answer already it would make for an interesting study. Even in states that have high concentrations of non-English speakers, those concentrations don’t translate into across-the-boards numbers statewide. California for instance, while having a very large percent of non-English speakers still has many congressional districts that look no different than Arkansas or West Virginia. Additionally the map would be very useful in determining some the ethnic makeup of the Congressional districts in play to see exactly where immigrant voter registration drives might play an important role in upcoming elections. I’m sure I haven’t even touched the tip of iceberg as to the uses for this interactive tool, and recommend to anyone with a few extra moments to play around with it and see what you can find out … about your own area and others.

    Read More...